Your Market Overview For 2020, Is there a market bubble coming?
Your Market Overview For 2020, Is there a market bubble coming?
Wow, what a year it has been! What does today's market look like you say? Let's take a look!
I looking at things historically so you really can see the big picture. Covid19 definitely had it challenges but really it did not affect Minnesota's market.
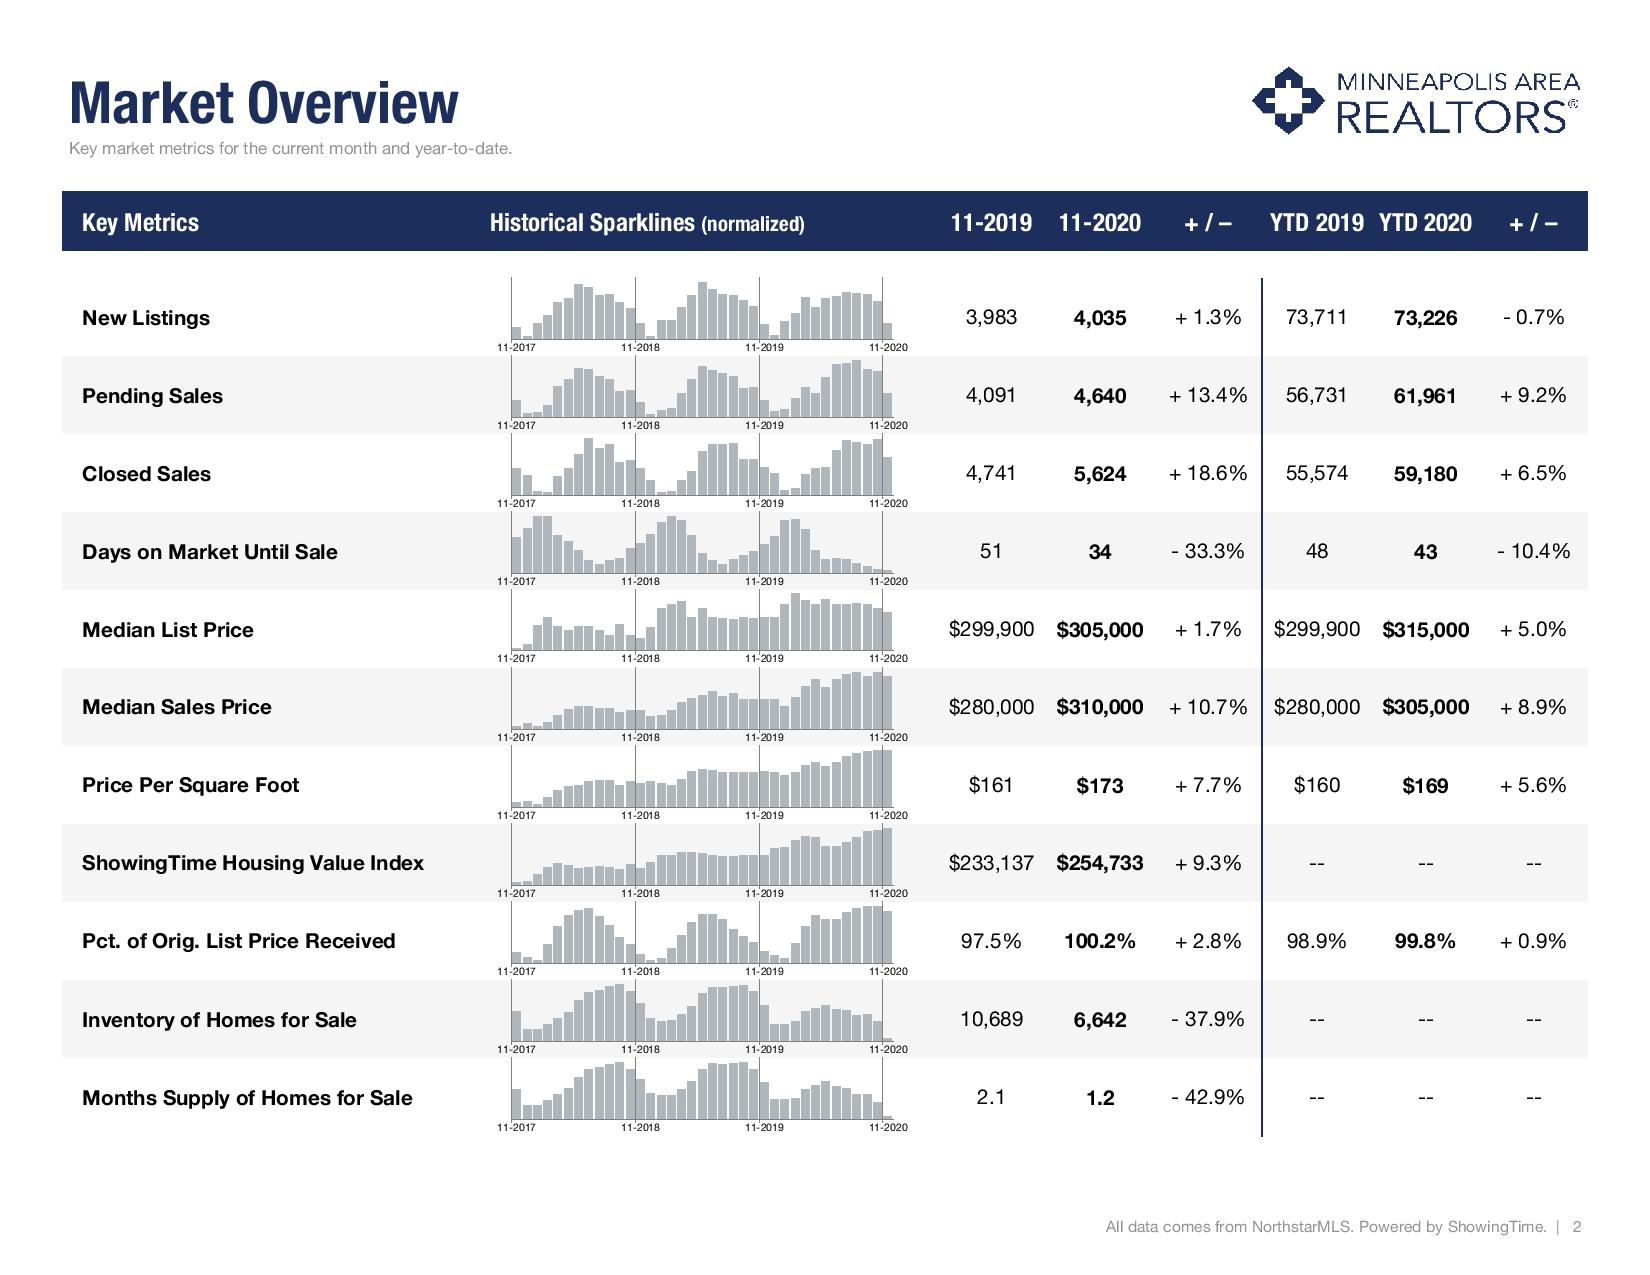
Let’s compare 2019 to 2020:
New Listings are down just a small percentage but pending sales are up over 9%, closed sales are up over 6% from last year. Our market time is down 10% from last year still making it a phenomenal year for sellers. Let's talk about Median sales price! It's up almost 9% with price per sq ft going up about 5.5%.
Many people say and ask if the bubble is coming? As far as I can see right now, No. How do I know this? Let's look more historically at the trends. **Now I am not a fortune teller and I cannot foresee completely into the future. Seeing that we still are in the middle of this pandemic. Some things are still unknown, but what I do know is that if you do watch trends you can really see what can be lying ahead. Go to my second chart and let's talk more down there.

Let's start by looking at 1960-2008 (chart below). You can see in the late 90's housing was appreciating more and more each year. In 2006 the bubble was starting to burst and the worst of all of this is that nobody was really talking about what really was happening.
Finally in 2008 it crashed hard! It took years to figure out just how much illegal dealings were going on but the financial crisis was primarily caused by deregulation in the financial industry.
Lenders really relaxed their strict lending practices to extend credit to people who were less than qualified. So in turn this drove up housing prices to levels that many could not otherwise afford. Meanwhile, banks were repackaging these mortgages & selling them to investors on the secondary market (The 2008 stock market crash took place on Sept. 29, 2008, when the Dow Jones Industrial Average fell 777.68 percent.) Information from: Veneta Lusk
We know from historical trends that the average rate of appreciation is 5.4%. After adjusting for inflation, the average rate of appreciation is 1.8%. Look at the blue line which is the average sales price. The rate of growth starting in 1960 was about 5.4%, this is the range that we should be in. So let's go back to our chart and look at the years of 2009 - to Now. It took awhile for our real estate market to come back but from looking at our trends and historical information we actually are right on track and actually a little below the average appreciation rate.
According to Bankrate.com Mortgage Interest rates will rise throughout the year but still at a historically low rate, still way under 4%. With Interest rates still so low and Lenders having stricter lending rules let's just say I feel comfortable saying NO to a bubble in 2021.

Today’s market has many challenges so having the right Realtor and Advocate is a MUST. Learn more here about what I do differently for my Sellers & Buyers.
Whether you are thinking of selling or buying check out My FREE Ultimate Seller's Guide & My FREE Ultimate Buyer's Guide
If you are looking for Homes For Sale Look No Further!! Search All Home For Sale Here!
Need help finding A LOAN OFFICER? CLICK HERE to connect with Jane Johanns with New American Funding & you can also fill out an Application to get pre qualified.
CLICK HERE for a Mortgage Calculator


